Every second, financial markets generate new price information.
Prices move up.
Prices move down.
Sometimes the market trends strongly, while at other times it moves sideways without a clear direction.
For a beginner, a trading chart can look like a random collection of red and green candles.
But experienced traders study these price movements to understand market behavior, momentum, trends, and important price zones.
This process is known as technical analysis.
In this beginner’s guide, TWPFOREX explains what technical analysis is, how it works, and the key concepts you should understand before analysing a trading chart.
What Is Technical Analysis?
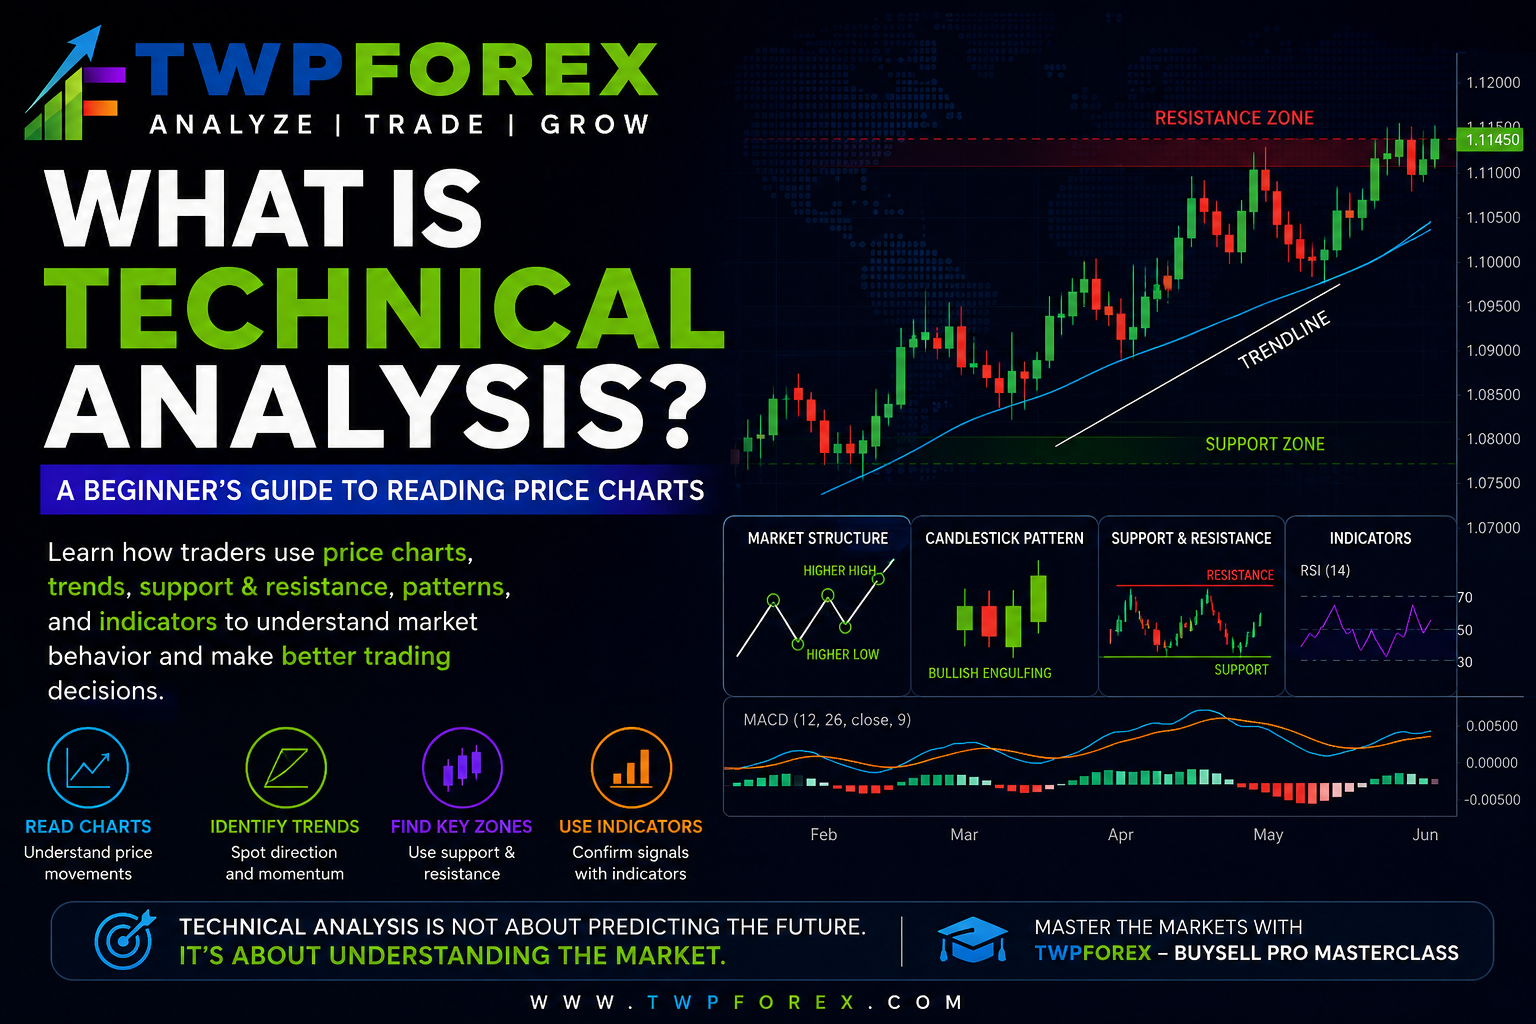
Technical analysis is the process of studying historical and current price movements to understand market behavior and evaluate possible future price scenarios.
Traders primarily analyze:
- Price charts
- Market trends
- Support and resistance
- Candlestick patterns
- Chart patterns
- Momentum
- Trading indicators
- Market structure
The objective is not to predict every market movement perfectly.
Instead, technical analysis helps traders develop a structured framework for making trading decisions.
At TWPFOREX, we believe:
We don’t predict the market. We help you understand it.
How Does Technical Analysis Work?
Technical analysis is based on observing how price behaves on a chart.
For example, imagine that the price of an instrument repeatedly moves down to a specific level and then begins rising.
A trader may identify this area as a potential support zone.
Similarly, if price repeatedly reaches a higher level and struggles to move above it, traders may identify a potential resistance zone.
Technical traders study these repeated behaviors to understand where buyers and sellers may become active.
However, no technical level guarantees a particular market reaction.
Technical analysis should always be combined with risk management and disciplined execution.
The Three Basic Principles of Technical Analysis
There are three commonly discussed principles behind technical analysis.
1. Price Reflects Available Market Information
Market prices can react to numerous factors, including:
- Economic data
- Interest rates
- Central bank decisions
- Market sentiment
- Institutional activity
- Geopolitical developments
Technical traders study how these factors are reflected through price behavior.
2. Prices Often Move in Trends
Markets frequently develop directional movements. The three basic market conditions are:
Uptrend: Price generally forms: Higher Highs + Higher Lows
This may indicate bullish market structure.
Downtrend: Price generally forms: Lower Highs + Lower Lows
This may indicate bearish market structure.
Sideways Market: Price moves within a defined range without a strong directional trend. Identifying the market condition is an important part of technical analysis.
3. Market Behavior Can Show Repeating Characteristics
Traders often react to fear, greed, uncertainty, and opportunity.
Because human behaviour can show recurring characteristics, certain price formations and market reactions may appear repeatedly on charts.
This is why traders study:
- Candlestick patterns
- Chart formations
- Support and resistance
- Market structure
Past patterns do not guarantee future outcomes, but they can provide useful analytical context.
What Is a Price Chart?
A price chart visually displays how the price of a financial instrument changes over time.
Charts can be used to analyze:
- Forex currency pairs
- Gold (XAUUSD)
- Silver (XAGUSD)
- Stocks
- Indices
- Other financial instruments
The horizontal axis generally represents time.
The vertical axis represents price.
As price changes, the chart records market movement.
Types of Trading Charts
Traders commonly use three types of charts.
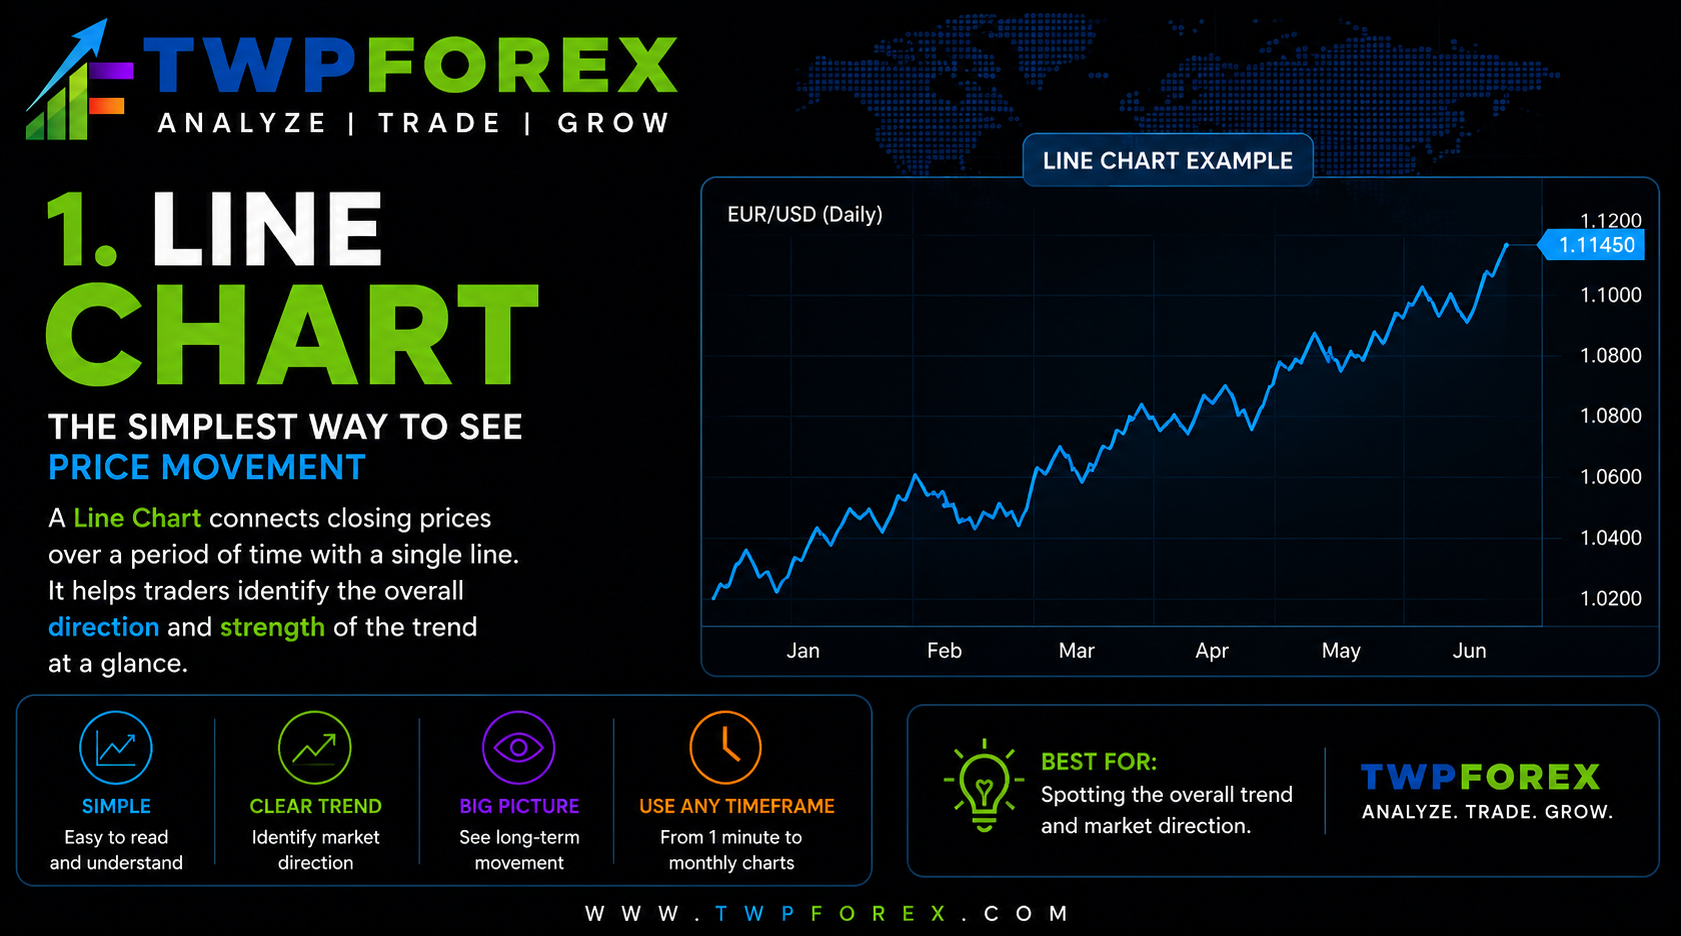
1. Line Chart
A line chart connects price points using a continuous line. It provides a simple view of general price direction. Line charts can be useful for understanding the broader market trend.
2. Bar Chart
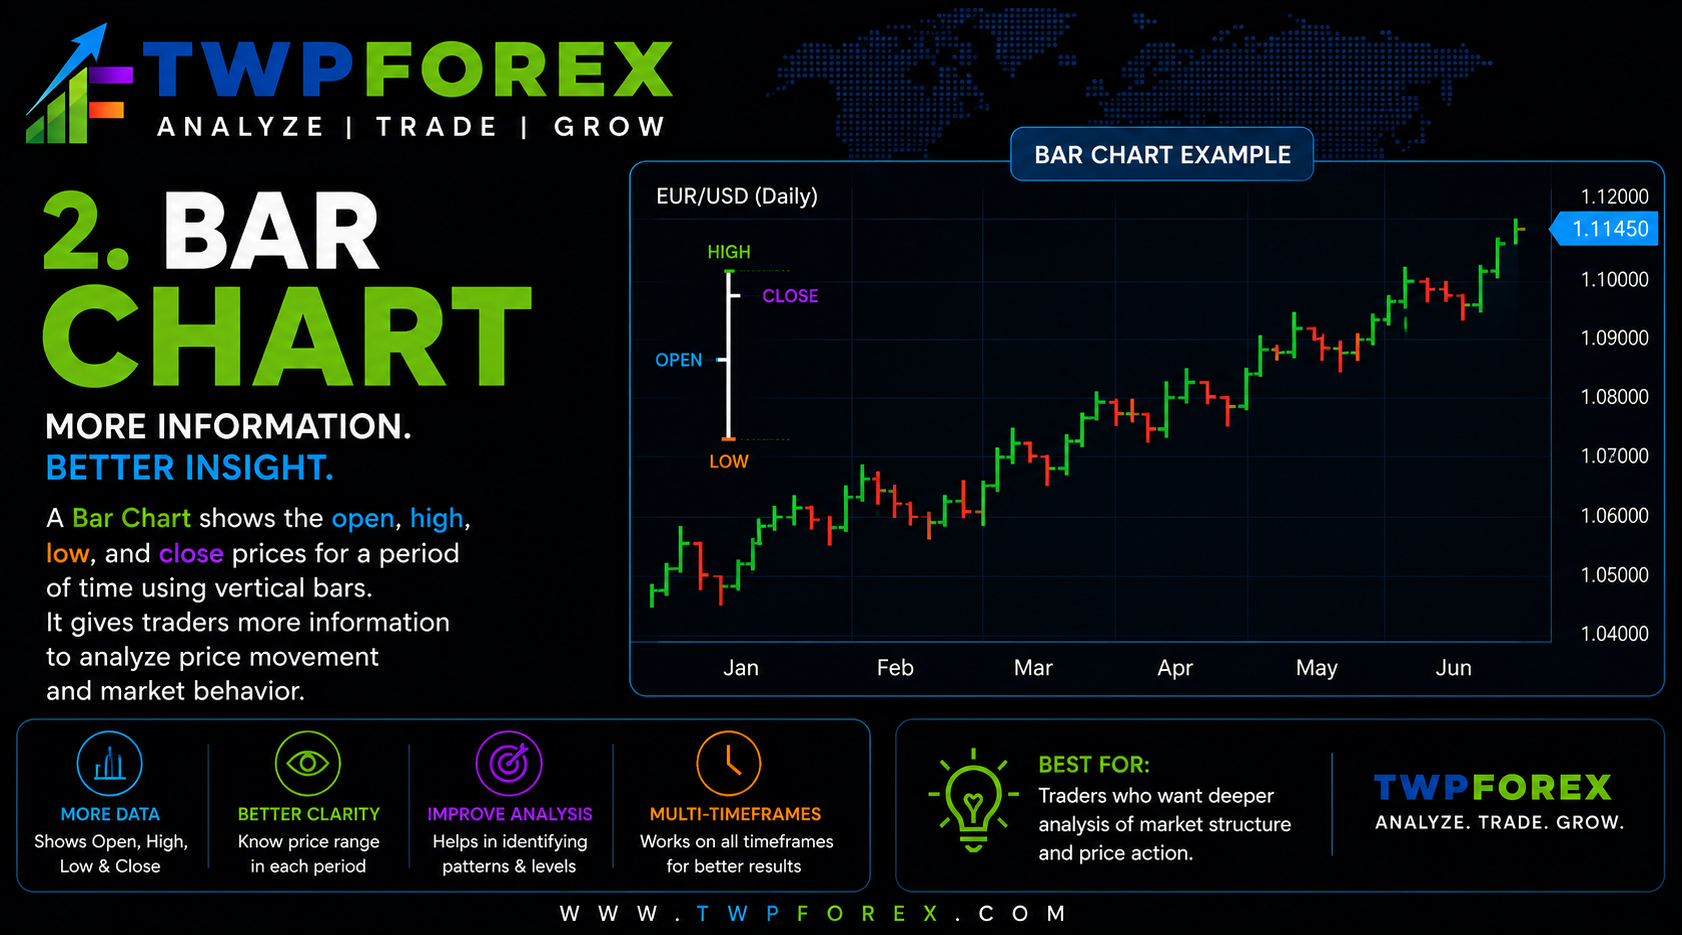
A bar chart displays additional price information. Each bar can show:
- Open
- High
- Low
- Close
Bar charts provide more information than basic line charts.
3. Candlestick Chart
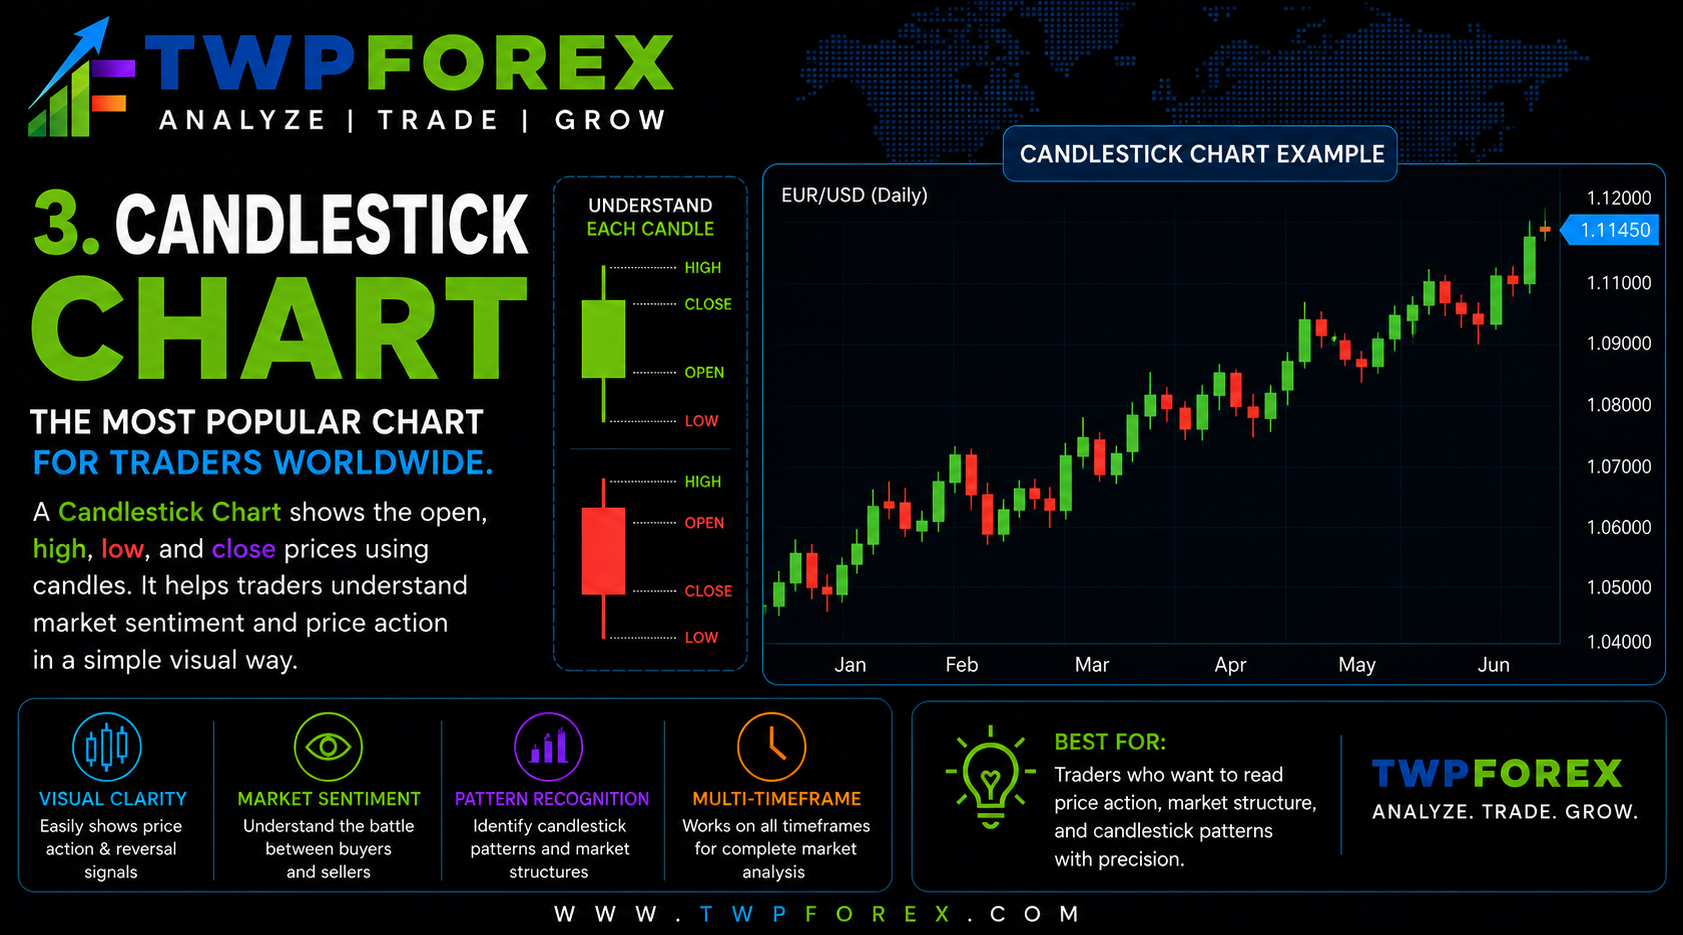
Candlestick charts are widely used by technical traders.
Each candle generally shows four important prices:
Open – High – Low – Close
Candlesticks help traders visually understand the battle between buyers and sellers during a specific period.
At TWPFOREX, candlestick charts are an important part of structured chart analysis.
Understanding Timeframes
Every candle represents a specific period of time.
For example:
- 1-Minute Chart
- 5-Minute Chart
- 15-Minute Chart
- 30-Minute Chart
- 1-Hour Chart
- 4-Hour Chart
- Daily Chart
- Weekly Chart
A candle on the 5-minute chart represents five minutes of price activity.
A candle on the daily chart represents one trading day’s price activity.
Different timeframes can show different market structures.
This is why professional traders often use multi-timeframe analysis.
For example, a trader may study the broader trend on a higher timeframe and use a lower timeframe for detailed analysis.
What Is Support and Resistance?
Support and resistance are fundamental concepts in technical analysis.
Support
Support is a price area where buying activity may become stronger.
Price may slow down, consolidate, or react upward from this area.
Resistance
Resistance is a price area where selling activity may become stronger.
Price may struggle to continue higher or react downward.
An important point is that support and resistance are often better understood as zones rather than exact single-price lines.
What Is Market Structure?
Market structure helps traders understand the directional behavior of price.
Traders analyze:
- Swing highs
- Swing lows
- Higher highs
- Higher lows
- Lower highs
- Lower lows
For example:
Higher High → Higher Low → Higher High
may indicate bullish structure.
Similarly:
Lower Low → Lower High → Lower Low
may indicate bearish structure.
Understanding market structure can help traders avoid taking positions without considering the broader price direction.
What Are Candlestick Patterns?
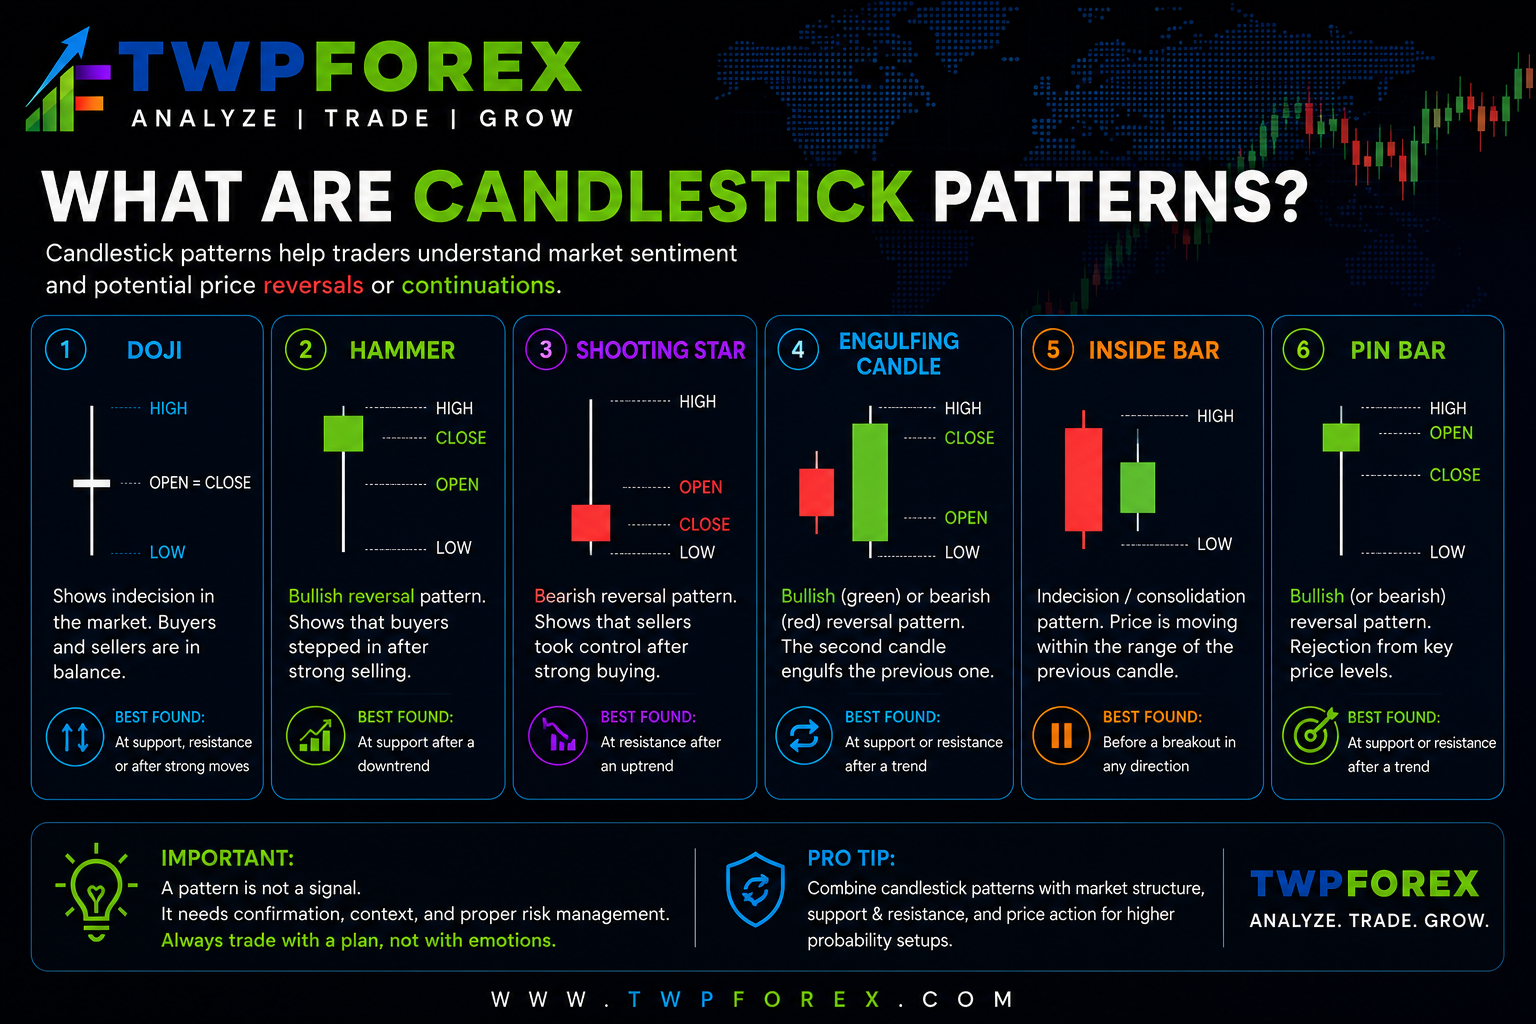
Candlestick patterns visually represent price behavior during a particular timeframe.
Common patterns include:
- Doji
- Hammer
- Shooting Star
- Engulfing Candle
- Inside Bar
- Pin Bar
However, a candlestick pattern should not automatically be treated as a buy or sell signal.
Context matters.
The same candle can have different significance depending on:
- Market structure
- Trend direction
- Support or resistance
- Liquidity
- Timeframe
- Market session
Professional analysis focuses on the complete market context rather than one isolated candle.
What Are Technical Indicators?
Technical indicators are mathematical calculations based on market data such as price or volume.
Popular indicators include:
Moving Average: Helps traders observe the general price direction.
EMA – Exponential Moving Average: Places greater emphasis on recent price data.
RSI – Relative Strength Index: Measures price momentum using a defined calculation.
MACD: Helps traders study momentum and trend relationships.
Fibonacci Tools: Often used to identify potential retracement and extension areas.
Indicators can provide useful information. However, adding too many indicators can create confusion. At TWPFOREX, the focus is on using tools with a clear purpose rather than filling charts with unnecessary indicators.
Price Action vs Indicators
One common question beginners ask is:
Should I use price action or indicators?
Price action traders primarily study the direct movement of price.
Indicator-based traders use mathematical tools to support their analysis.
Neither approach automatically guarantees better results.
A structured trader may combine:
Market Structure + Price Action + Selected Indicators + Risk Management
The key is understanding why you are using each tool.
Never add an indicator simply because another trader uses it.
Can Technical Analysis Predict the Market?
No analytical method can predict every market movement with certainty.
Unexpected economic events, geopolitical developments, and sudden changes in market sentiment can cause significant price movements.
Technical analysis is better viewed as a decision-making framework.
It can help traders:
- Understand market direction
- Identify important price zones
- Evaluate trade scenarios
- Define entry conditions
- Plan stop-loss levels
- Identify potential exits
The goal is structured decision-making—not perfect prediction.
Common Technical Analysis Mistakes
Beginners often make several mistakes when analyzing charts.
Using Too Many Indicators
More indicators do not necessarily mean better analysis.
Ignoring Higher Timeframes
A lower-timeframe setup may conflict with broader market structure.
Drawing Too Many Levels
Marking every high and low can make the chart difficult to interpret.
Forcing Chart Patterns
Traders sometimes see patterns because they want to find a trade.
Trading Every Signal
Not every technical signal represents a quality trading opportunity.
Ignoring Risk Management
Even a strong technical setup can fail.
Risk must always be controlled.
How Can Beginners Learn Technical Analysis?
A structured learning process can make technical analysis easier to understand.
Start with:
- Learn how candlestick charts work.
- Understand market structure.
- Study trends and ranges.
- Learn support and resistance.
- Identify swing highs and swing lows.
- Study basic price action.
- Learn one indicator at a time.
- Practice multi-timeframe analysis.
- Backtest your observations.
- Maintain a trading journal.
Avoid trying to learn every strategy at once.
Master the basics before moving to advanced concepts.
The TWPFOREX Approach to Technical Analysis
At TWPFOREX, technical analysis is not about adding dozens of indicators or searching for a magical buy-and-sell signal.
Our approach focuses on understanding:
- Market structure
- Price behavior
- Liquidity
- Momentum
- Multi-timeframe context
- Entry conditions
- Risk management
- Trading discipline
The objective is to help traders develop a repeatable analytical process.
This philosophy is also reflected in the TWPFOREX – BUYSELL PRO Masterclass, where structured market analysis and disciplined execution remain central to the learning process.
Final Thoughts
Technical analysis is one of the most important skills a trader can develop.
It helps transform a confusing price chart into a structured source of market information.
However, technical analysis should never be treated as a guaranteed prediction system.
The real value comes from learning how to observe price, understand market context, create trading rules, and manage risk responsibly.
Start with the basics.
Study the charts.
Practice consistently.
And focus on understanding the market before trying to trade every movement.
Technical analysis is one of the tools traders can use to understand what price is doing before making a decision.
Analyze. Trade. Grow.
About TWPFOREX
TWPFOREX is a trading education platform focused on structured market learning, disciplined trading principles, and practical technical analysis.
Our mission is simple:
We don’t predict the market. We help you understand it.